Why is PageSpeed Insights worse than my local Lighthouse score?
Same URL, same Lighthouse engine: different CPU, throttling, and cache. Compare tools fairly instead of merging the scores.
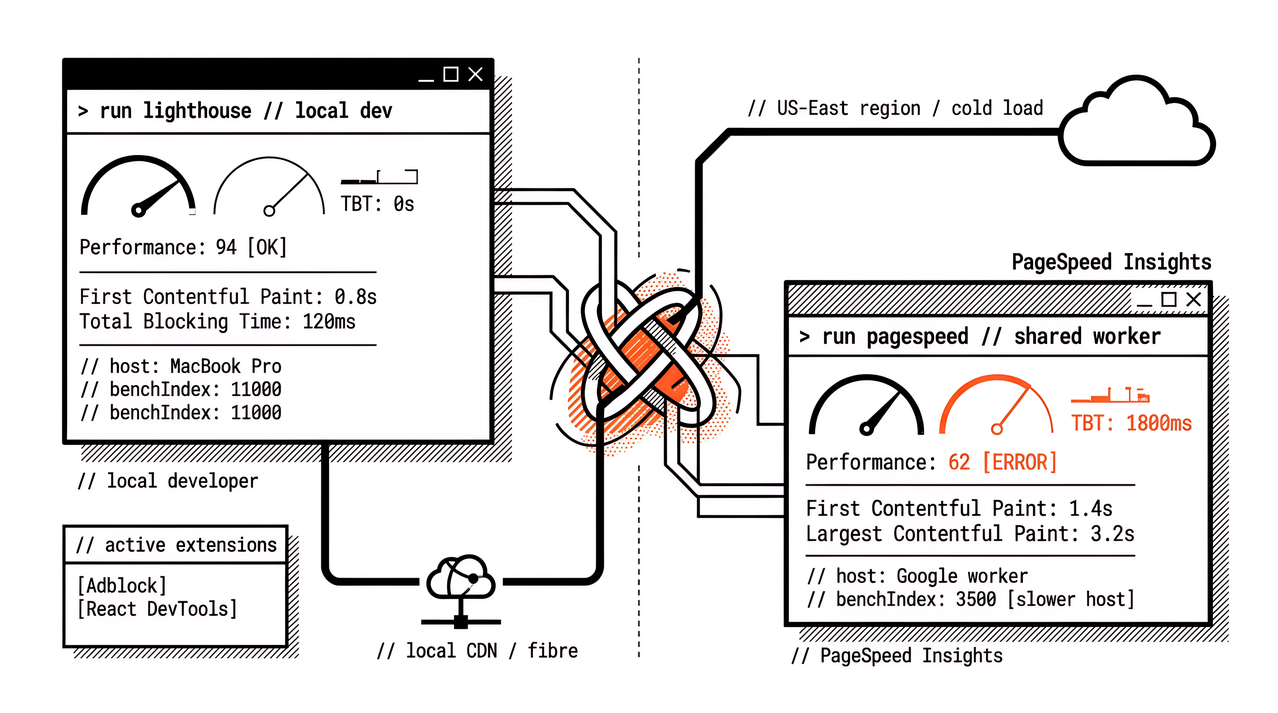
You run Lighthouse in Chrome DevTools on a client URL and see Performance 94. You paste the same URL into PageSpeed Insights and the lab Performance score drops to the sixties. The audits look related. The numbers do not. Neither result is “lying.” They ran the same Lighthouse family of audits on different machines, with different throttling behaviour, and often with different cache and extension state.
That gap shows up constantly in agency Slack threads and client calls. People then optimise against the friendlier number, or treat PageSpeed Insights as broken. What follows explains why PageSpeed Insights lab data is often worse than a local Lighthouse run, how to compare fairly, and which result to trust for client work. For how Lighthouse turns metrics into a score, see How Lighthouse Performance Scores Are Recorded and Calculated. For when one-off PageSpeed Insights checks stop being enough, see PageSpeed Insights vs Automated Monitoring.
Same Lighthouse engine, different machines
PageSpeed Insights lab results are Lighthouse runs on Google’s shared infrastructure. Chrome DevTools Lighthouse and the Lighthouse CLI run on your laptop. The audit set is related. The CPU is not.
Lighthouse records a benchmarkIndex (device score) that describes how fast the host can run JavaScript before the audited page load. A powerful developer machine often scores much higher than the PageSpeed Insights workers. Mobile runs also apply a CPU slowdown (commonly described as about 4×) so the lab approximates mid-tier phones. Four times a fast laptop is still faster than four times a slower shared worker. Long tasks, Total Blocking Time, and Interaction to Next Paint proxies move first when the host is slower. Largest Contentful Paint and other paint timings can move too when layout and script work stretch.
Network path and test location add another layer. PageSpeed Insights picks from a small set of regions. Your laptop sits on your office fibre next to a nearby CDN edge. Cold loads on a distant worker see different latency even before CPU differences matter.
So a lower PageSpeed Insights lab score does not prove the site “got worse overnight.” It often proves you compared two hosts.
Why Total Blocking Time jumps on PageSpeed Insights
Total Blocking Time is especially sensitive to host speed. It sums the portions of long tasks that exceed 50 milliseconds during page load. On a fast local CPU, many tasks finish just under that line and never enter Total Blocking Time. On a slower PageSpeed Insights worker, the same work crosses 50 milliseconds and the metric spikes. Performance score then falls even when First Contentful Paint only moved a little.
That pattern is well documented in developer threads and Lighthouse discussions: throttling and slower hosts push borderline tasks over the threshold. Simulated throttling (PageSpeed Insights lab default) is also not the same as packet-level throttling used by some other lab tools. Treat PageSpeed Insights lab numbers as one environment, not as a perfect replay of your MacBook.
Local pollution: extensions, cache, and warm state
Local Lighthouse can look better for reasons that have nothing to do with the production HTML.
Chrome extensions inject scripts and change network behaviour. A warm disk cache and service worker can skip work that a cold PageSpeed Insights load always pays. Cookie banners and consent layers may already be dismissed on your profile. Antivirus, VPN, and other processes on the machine add noise. DevTools may warn when it detects conditions that skew the audit; PageSpeed Insights starts from a cleaner cold profile on Google’s side.
Use an Incognito window with extensions disabled, or the Lighthouse CLI against a clean profile, when you need a local baseline. Even then, expect residual host-speed differences versus PageSpeed Insights. A clean local profile removes extension noise; it does not turn your laptop into Google’s lab workers.
Do not mix PageSpeed Insights field data with local lab
PageSpeed Insights shows two stories on one page. The top block is Chrome UX Report field data when enough real Chrome users visited the origin or URL. The lower block is a fresh Lighthouse lab run.
Your local Lighthouse score is lab only. Comparing a local Performance score to the field Core Web Vitals categories is a category error. Field windows cover days of real devices and networks. Lab is one controlled load. Lab-versus-field reconciliation is a separate topic; here the focus is local lab versus PageSpeed Insights lab.
If field looks healthier than PageSpeed Insights lab, users may be on faster devices, revisit with cache, or you may be reading origin-level field against a URL-level lab run. Calibrate, do not average the two into one fake “truth.”
How to compare fairly (and what to trust for client work)
| Source | What it measures | Best use |
|---|---|---|
| Chrome DevTools / local CLI | Lab on your machine | Before/after while debugging the same URL |
| PageSpeed Insights lab | Lab on Google’s workers | Shareable cold-load baseline close to what clients paste |
| PageSpeed Insights field (CrUX) | Real-user Core Web Vitals | Trend and eligibility, not a Lighthouse score twin |
Rules that keep agencies from mixing incompatible scores:
- Compare before and after on the same tool. Local 94 → local 88 after a change is useful. Local 94 versus PageSpeed Insights 61 is not a regression proof.
- Match strategy. Mobile versus mobile. Desktop versus desktop.
- Prefer cold loads when you claim a public score. Clear cache or use a clean profile locally.
- Read the device score / environment notes in the Lighthouse JSON when you need to explain a gap to a technical lead.
- For client reporting, prefer a stable lab path. Scheduled PageSpeed Insights-style runs from a monitoring product reduce “my laptop versus your laptop” arguments. Spot checks still help debugging; they are a weak single source of truth for retainers.
DebugBear’s comparison of PageSpeed Insights and Lighthouse, and Google’s own Lighthouse variability notes, make the same point: synthetic scores depend on CPU, location, Chrome version, and throttling method. Absolute equality across tools is the wrong goal. Directional agreement on the same tool is the right one.
FAQ
Is PageSpeed Insights “more accurate” than local Lighthouse?
For cold-load lab diagnostics that clients can reopen in a browser, PageSpeed Insights is often the better shared reference. For day-to-day engineering, local Lighthouse before/after on the same machine is faster and still valid. Neither replaces field Core Web Vitals when you need real-user truth.
Why does my local Lighthouse match PageSpeed Insights sometimes?
When host speeds are closer, the URL is light on main-thread work, or the runs simply land nearer each other, gaps shrink. Heavy JavaScript and layout work widen them. Treat occasional agreement as luck on a light page, not proof that the two environments are interchangeable.
Should I raise local CPU slowdown until scores match PageSpeed Insights?
You can experiment with CLI throttling for research. Do not treat a personalised slowdown as a contract with the client unless everyone agrees that environment is the baseline. Document the tool and settings you will use in the retainer.
Does a better local score mean Search Console will improve?
Not by itself. Search Console and Chrome UX Report track field data. Lab wins help you find fixes; field windows confirm whether real users felt them.
What to do next
Pick one money URL. Run Lighthouse twice locally in a clean profile and note the spread. Run PageSpeed Insights lab on the same URL and strategy. Write down host differences instead of merging the scores. Put the PageSpeed Insights lab number (or a scheduled monitoring run) in the client pack when you need a shareable baseline, and keep local Lighthouse for the fix loop.
If you manage many client origins, automate the PageSpeed Insights-shaped lab path so every site uses the same cold-load recipe. That is the operational answer to “whose Lighthouse do we believe?”: agree the environment once, then track change inside it. Spot laptop runs stay useful for debugging; they should not be the only number in the monthly pack.
References
- PageSpeed Insights vs. Lighthouse: What's the Difference? (DebugBear)
- Lighthouse variability / scoring environment (Chrome Lighthouse docs)
- Why Lighthouse via PageSpeed Insights API differs from CLI (Stack Overflow)
- Why TBT on PageSpeed Insights differs from a local machine (Stack Overflow)
- How Lighthouse Performance Scores Are Recorded and Calculated (Apogee Watcher)
- PageSpeed Insights vs Automated Monitoring: When Manual Checks Aren't Enough (Apogee Watcher)