What automated web performance monitoring is (and what it is not)
Schedules, budgets, alerts, and history for page experience: not a one-off PageSpeed Insights paste, not APM, and not a bot that rewrites the theme.
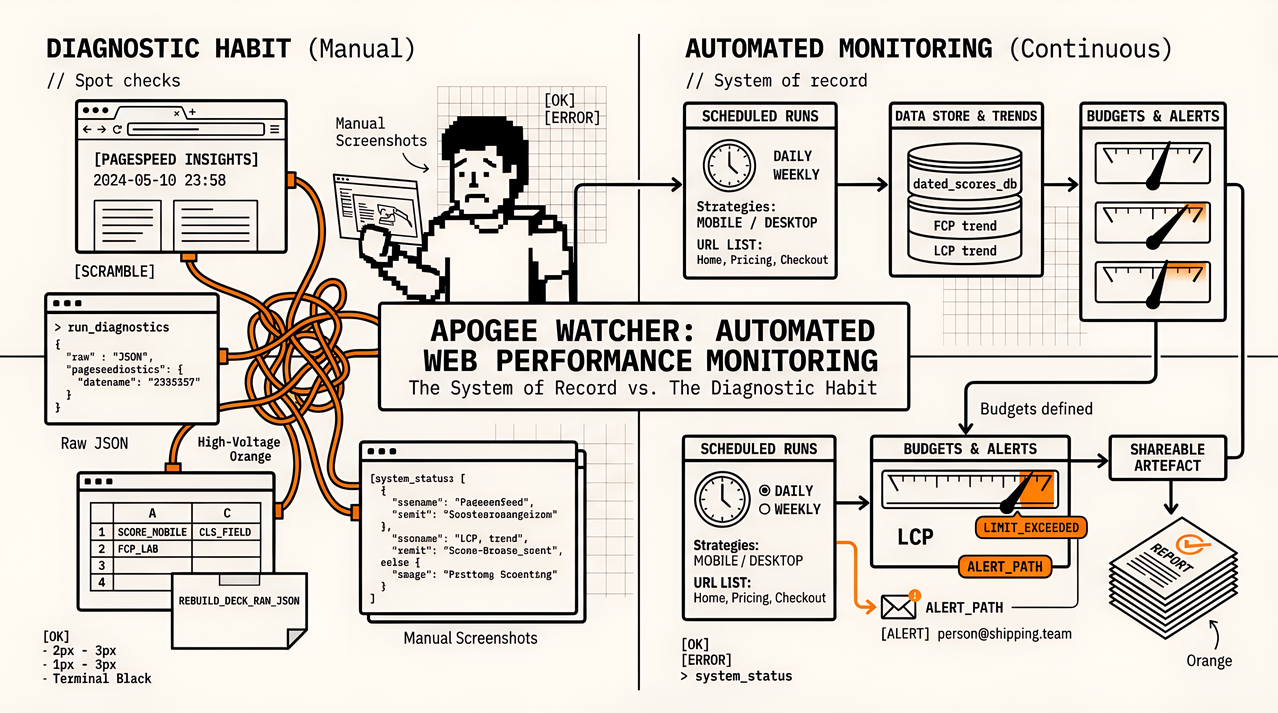
A sprint ticket says “add performance monitoring,” and the pull request that closes it often ships one of two artefacts: a Lighthouse CI gate on preview URLs, or a screenshot from PageSpeed Insights taken the night before the review. Both are useful, but neither is automated web performance monitoring on its own. Monitoring means the same production URLs keep getting measured on a schedule, numbers are stored with dates, budgets can fail loudly, and someone gets a report without rebuilding a deck from raw JSON.
The full glossary for agencies, including the five-job checklist and portfolio framing, lives on our blog in What Is Automated Web Performance Monitoring?. The decision line between a useful spot check and a system of record is in PageSpeed Insights vs Automated Monitoring. What follows is the shorter developer framing: what the phrase means in a shipping team, what it is not, and how lab and field clocks fit without muddling the ticket.
What automated web performance monitoring means for a shipping team
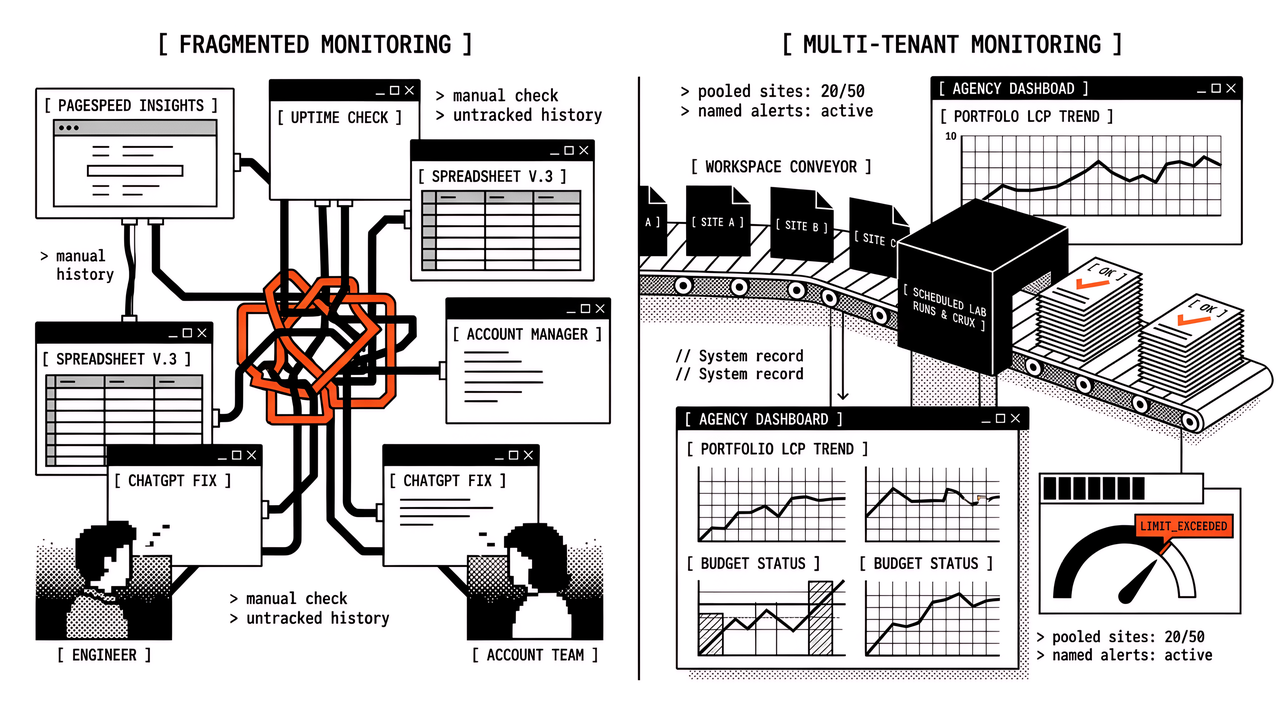
Automated web performance monitoring is a repeating measurement system for how pages load and respond. It stores results over time and notifies someone when agreed thresholds break. In a PageSpeed-shaped stack that usually means scheduled laboratory runs (Lighthouse / PageSpeed Insights on chosen URLs) plus field signals when they exist (Chrome User Experience Report categories or first-party real-user monitoring). Continuity is the point: same URLs, same strategies, dated history, and a written rule for what happens when Largest Contentful Paint, Interaction to Next Paint, or Cumulative Layout Shift drifts.
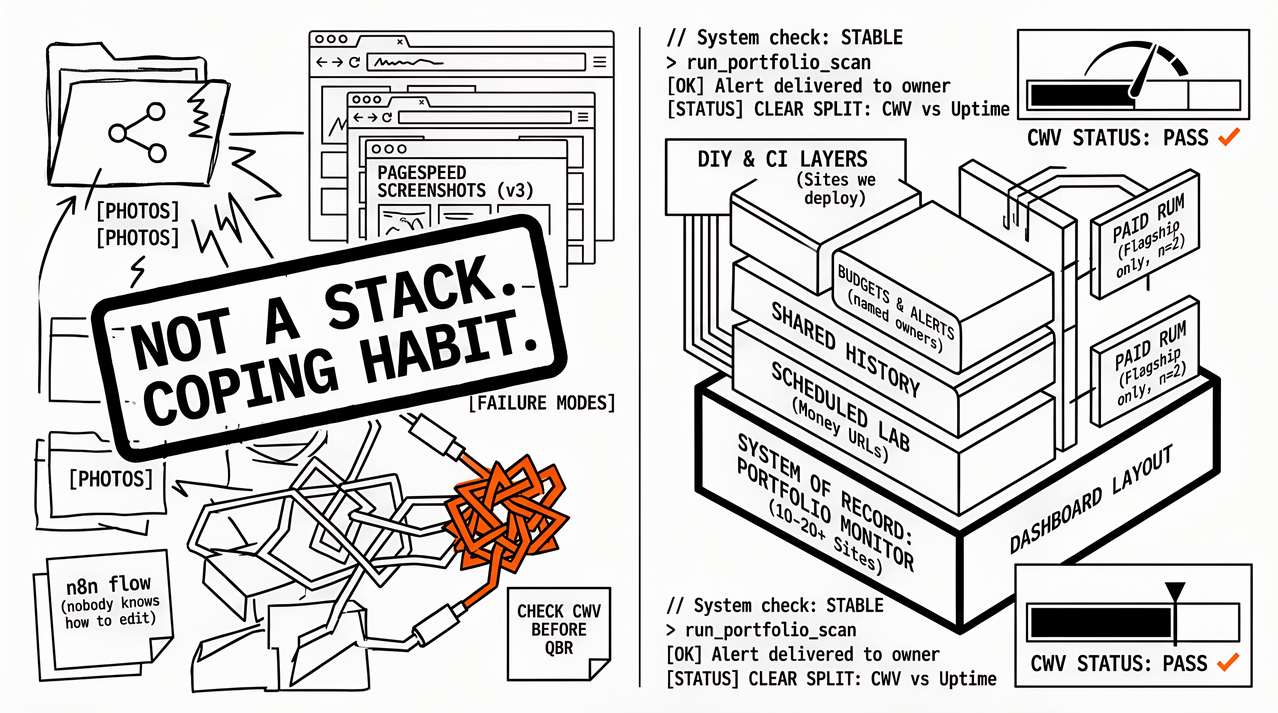
If you cannot point to the URL list, the schedule, the budget language, and the alert path in one sentence, you do not have monitoring yet; you have a diagnostic habit. Diagnostics stay valuable for investigation. They still do not replace the loop that catches a regression three days after merge while nobody is staring at a dashboard.
Five jobs that make monitoring automated
Treat these as contracts, not nice-to-haves. Miss one and teams quietly return to screenshots and memory. The list below is the shortest engineering checklist we use when a ticket claims “monitoring” but the work still looks like a scramble.
URL coverage that matches real journeys. Home, pricing, checkout, and key templates repay the work. Homepage-only vanity rarely does.
A schedule. Daily, weekly, or denser runs on mobile and desktop as needed, not “when someone remembers.”
Stored history. Scores and metrics you can trend across releases, not a fresh zero every paste.
Budgets and alerts. Thresholds written once, plus notification when a metric breaches, with enough cooldown that channels stay unmuted.
A shareable artefact. A report, export, or share link an account lead can send without rebuilding a deck from API JSON.
Automation here means the schedule runs without a human clicking Analyse. The budget language stays stable across months. The alert reaches the person who can open a ticket. Branding on a PDF does not replace those jobs.
What automated web performance monitoring is not
Not a one-off PageSpeed Insights run. Opening PageSpeed Insights once diagnoses a URL at one moment. Spot checks remain the right tool for investigation. They become the wrong system of record when two people disagree because they ran different strategies on different days, or when clients pay for “monitoring” and only receive a scramble before the call.
Not application performance monitoring. APM watches servers, traces, and services. Web performance monitoring watches page experience for visitors: load, interactivity, and layout stability. Teams often need both. Confusing them produces either a backend tool forced into Core Web Vitals reporting, or a front-end schedule that never explains API latency.
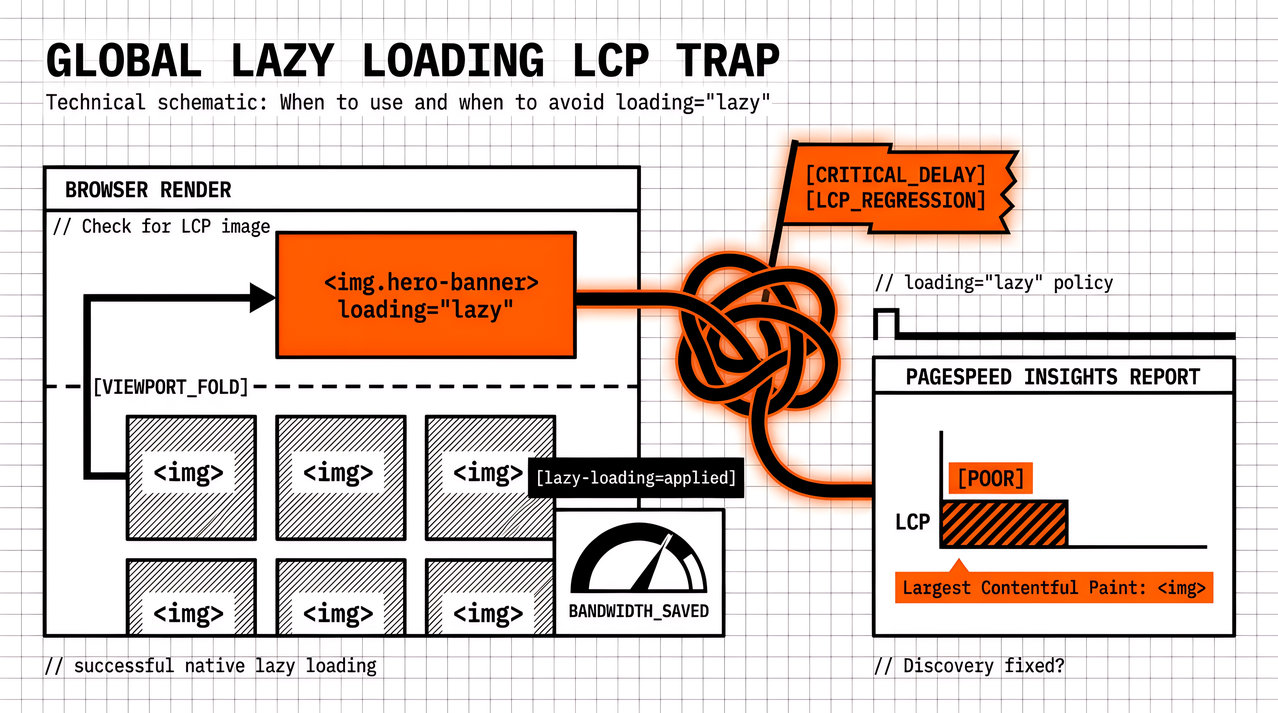
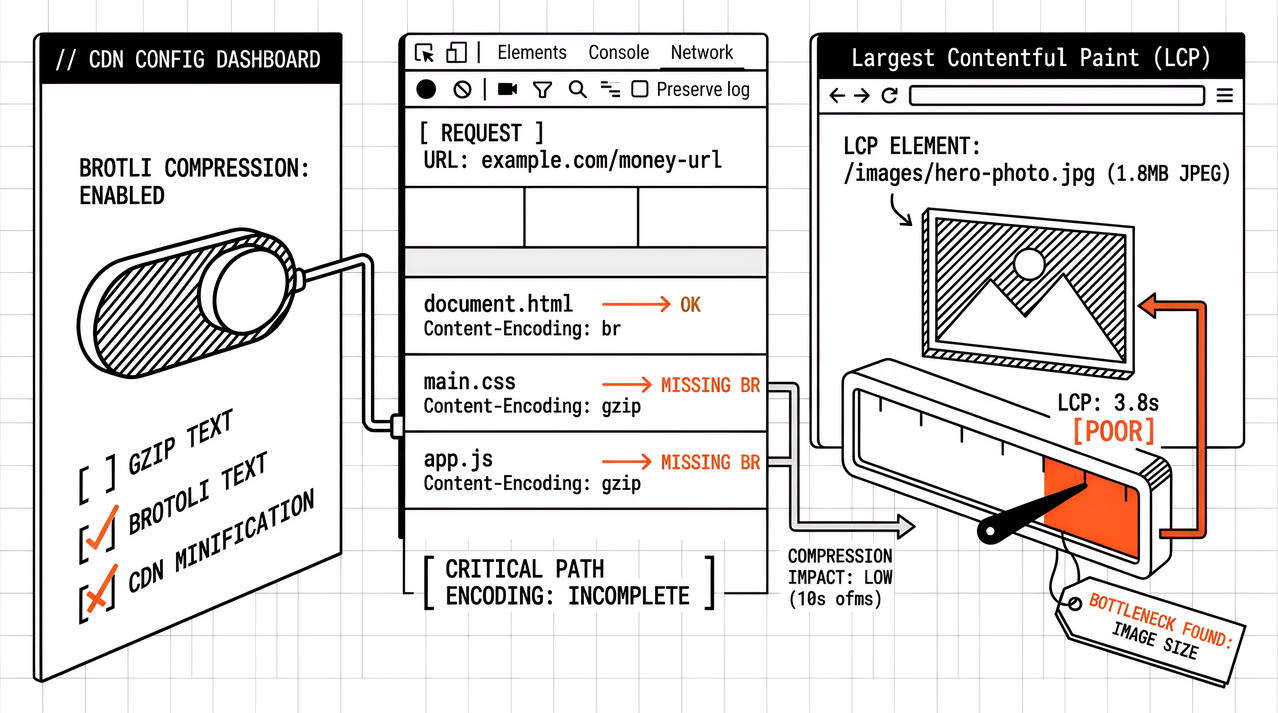
Not an auto-fix bot. Monitoring tells you when LCP on /checkout left budget. It does not ship image compression, remove a tag manager container, or rewrite a Magento theme. Fixes stay with humans, or with a separate delivery project that owns the change.
Not uptime-only monitoring. HTTP 200 on the homepage does not mean Core Web Vitals are healthy. Uptime and TLS checks answer availability. Performance monitoring answers experience. Run both when the retainer promises both; do not treat one green light as the other.
Not a substitute for Lighthouse CI alone. Merge gates protect preview URLs you listed, while portfolio monitoring watches production or staging on a calendar. Keep continuous integration thin and put production surveillance on schedules. The two jobs complement each other when the labels stay honest.
Lab schedules and field data in the same programme
Readers often ask whether automated monitoring is synthetic or real-user monitoring. Durable programmes use both clocks and label them separately. The table below is the pairing we keep in tickets and client decks.
| Clock | What it measures | Typical source | Best use |
|---|---|---|---|
| Lab (synthetic) | Controlled run on a chosen URL and strategy | Scheduled PageSpeed Insights / Lighthouse | Regression after deploy; comparable history; budgets you can retest tomorrow |
| Field (RUM / CrUX) | What real visitors experienced over a window | CrUX in PageSpeed Insights, Search Console, or first-party RUM | Experience Google associates with the origin; device and network mix lab misses |
Lab answers what happens when you retest a URL under your conditions, and field answers what users experienced in the last collection window. Mixing them into one green or amber story without labels is how client reports lose trust. MDN’s comparison of real-user monitoring and synthetic monitoring is a useful external orientation; the operational habit is simpler: name the clock in every slide and ticket.
When PageSpeed Insights alone is not monitoring
PageSpeed Insights remains the right first diagnosis for a single URL. Keep using it to teach clients what Lighthouse and CrUX look like on one page. It stops being enough when you manage more URLs than you will honestly retest by hand each week, when regressions appear days after a deploy with no dated baseline, or when the retainer language already promises continuous coverage. That threshold is the subject of the PageSpeed Insights versus automated monitoring guide linked above. The glossary job here is shorter: once you need schedules, budgets, alerts, and history, you have left one-off testing, whether the PDF cover shows your agency logo or a vendor’s.
Automated PageSpeed monitoring is the same class of system when PageSpeed Insights (or equivalent Lighthouse lab runs) supply the scheduled measurements, often with CrUX field data in the same workflow. The phrase emphasises the Google PageSpeed-shaped stack agencies already recognise. It does not mean “we only care about the Performance score.”
FAQ
Does automated monitoring replace Lighthouse CI?
No. Lighthouse CI protects merges on the preview URLs you listed. Automated monitoring watches production or staging on a calendar. Keep continuous integration thin; put portfolio surveillance on schedules so production regressions still have a dated trail.
Does it replace Search Console or first-party RUM?
No. Search Console remains a field and indexing source for many SEO conversations. First-party RUM remains valuable where instrumentation is approved. Monitoring-first PageSpeed tools organise lab history and CrUX-in-PageSpeed Insights across many sites; they layer beside those sources rather than replacing them.
Is uptime monitoring enough for Core Web Vitals?
No. Uptime answers availability. Core Web Vitals answer experience. Run both when the retainer promises both, and keep the alerts on separate channels so an outage does not hide an LCP drift.
Is a green lab score proof the field story is fine?
No. Lab and field use different clocks. A favourable Lighthouse run can sit beside empty or amber CrUX rows when eligibility or sample size fails. Label both in the report so nobody sells a Core Web Vitals pass from lab alone.
CTA
Lock the language before you lock the tool. Automated web performance monitoring means schedules, budgets, alerts, history, and a client-readable artefact. One-off tests, APM, and uptime checks remain useful neighbours; they are not synonyms. For the longer agency glossary, use What Is Automated Web Performance Monitoring?. For the moment spot checks stop scaling, use PageSpeed Insights vs Automated Monitoring. When you want that loop across many client sites without farming API keys per account, try Apogee Watcher.
References
What Is Automated Web Performance Monitoring? (Apogee Watcher)
PageSpeed Insights vs Automated Monitoring: When Manual Checks Aren't Enough (Apogee Watcher)
About PageSpeed Insights (Google)
Automating audits with AutoWebPerf (web.dev)
PageSpeed Insights (Google)